Technical Analysis: Chart Patterns & Indicators
Introduction
Technical analysis is the study of historical price action to forecast future price movements. It's based on the premise that price movements are not random and that patterns tend to repeat over time.
Core Principles of Technical Analysis
1. Price Discounts Everything
All known information is reflected in the price. This includes:
- Economic data
- Political events
- Market sentiment
- Supply and demand
2. Price Moves in Trends
Markets tend to move in trends rather than random directions:
- Uptrend: Higher highs and higher lows
- Downtrend: Lower highs and lower lows
- Sideways: Range-bound movement
3. History Tends to Repeat
Market participants react similarly to similar situations, creating recognizable patterns.
Chart Types
1. Candlestick Charts
The most popular chart type, showing:
- Open: Starting price
- High: Highest price
- Low: Lowest price
- Close: Ending price
Bullish Candle: Close > Open (usually green/white) Bearish Candle: Close < Open (usually red/black)
2. Bar Charts
Similar to candlesticks but displayed as vertical bars with horizontal ticks.
3. Line Charts
Connect closing prices with a line. Simple but less detailed.
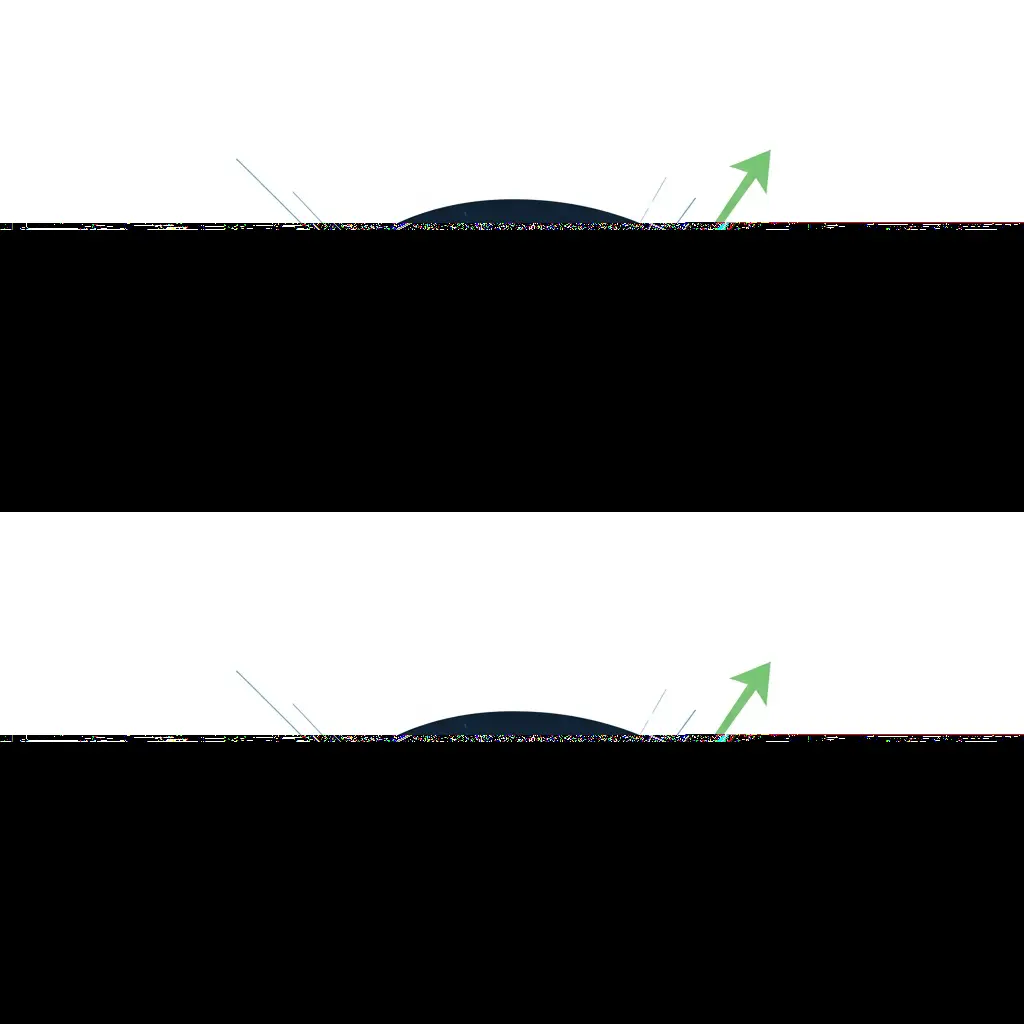
Key Chart Patterns
Reversal Patterns
1. Head and Shoulders
- Indicates trend reversal from bullish to bearish
- Three peaks: left shoulder, head (highest), right shoulder
- Neckline break confirms the pattern
2. Inverse Head and Shoulders
- Opposite of head and shoulders
- Signals bullish reversal
3. Double Top/Bottom
- Two peaks at similar levels (double top) = bearish reversal
- Two troughs at similar levels (double bottom) = bullish reversal
Continuation Patterns
1. Flags and Pennants
- Brief consolidation before trend continuation
- Flag: rectangular consolidation
- Pennant: triangular consolidation
2. Triangles
- Ascending Triangle: Bullish continuation
- Descending Triangle: Bearish continuation
- Symmetrical Triangle: Can break either way
3. Rectangles
- Horizontal consolidation
- Breakout direction indicates trend continuation
Support and Resistance
Support Levels
Price levels where buying pressure overcomes selling pressure:
- Previous lows
- Round numbers (psychological levels)
- Moving averages
- Fibonacci retracement levels
Resistance Levels
Price levels where selling pressure overcomes buying pressure:
- Previous highs
- Round numbers
- Moving averages
- Fibonacci extension levels
Key Concept: When support breaks, it often becomes resistance (and vice versa).
Technical Indicators
Trend Indicators
1. Moving Averages (MA)
- Simple Moving Average (SMA): Average price over X periods
- Exponential Moving Average (EMA): Gives more weight to recent prices
Common strategies:
- Price above MA = uptrend
- MA crossovers (e.g., 50 MA crosses above 200 MA = "Golden Cross")
2. MACD (Moving Average Convergence Divergence)
- Shows relationship between two moving averages
- Signal line crossovers: Buy/sell signals
- Divergence: Price and MACD moving in opposite directions
Momentum Indicators
1. RSI (Relative Strength Index)
- Measures speed and magnitude of price changes
- Scale: 0-100
- Overbought: Above 70
- Oversold: Below 30
- Divergence: Powerful reversal signal
2. Stochastic Oscillator
- Compares closing price to price range over time
- %K line and %D line (signal line)
- Overbought/oversold levels similar to RSI
Volatility Indicators
1. Bollinger Bands
- Three lines: Middle (SMA), Upper, Lower (standard deviations)
- Squeeze: Low volatility, potential breakout
- Expansion: High volatility
- Price touching bands can signal overbought/oversold
2. ATR (Average True Range)
- Measures market volatility
- Higher ATR = more volatile
- Useful for setting stop-losses
Volume Indicators
1. Volume
- Confirms price movements
- High volume on breakouts = stronger signal
- Divergence between price and volume = warning sign
2. On-Balance Volume (OBV)
- Cumulative volume indicator
- Rising OBV = buying pressure
- Falling OBV = selling pressure
Fibonacci Tools
Fibonacci Retracement
Common retracement levels:
- 23.6%
- 38.2%
- 50%
- 61.8% (golden ratio)
- 78.6%
Usage: Identify potential support/resistance during pullbacks
Fibonacci Extension
Common extension levels:
- 127.2%
- 161.8%
- 261.8%
Usage: Project potential profit targets
Multiple Timeframe Analysis
Analyze multiple timeframes for better context:
- Higher timeframe: Identify overall trend (daily, weekly)
- Trading timeframe: Find entry setups (4H, 1H)
- Lower timeframe: Fine-tune entries (15min, 5min)
Rule: Trade in the direction of the higher timeframe trend.
Putting It All Together
A Complete Analysis Process
- Identify the trend (higher timeframe)
- Find support/resistance levels
- Look for chart patterns
- Confirm with indicators
- Check volume
- Plan entry, stop-loss, and take-profit
Example Trade Setup
Scenario: EUR/USD Daily Chart
- Trend: Uptrend (price above 200 EMA)
- Pattern: Bullish flag forming
- Support: 50 EMA providing support
- RSI: Above 50, showing bullish momentum
- Entry: Break above flag resistance
- Stop-loss: Below flag support
- Target: Measured move from flag height
Common Mistakes to Avoid
- Using too many indicators (analysis paralysis)
- Ignoring the trend (trading against it)
- Not waiting for confirmation
- Forcing patterns that aren't there
- Neglecting risk management
Conclusion
Technical analysis is a powerful tool for forex traders. Master the basics first:
- Understand trends
- Identify support and resistance
- Learn key chart patterns
- Use a few reliable indicators
Remember: No indicator or pattern is 100% accurate. Always use proper risk management and combine technical analysis with sound trading psychology.
Practice on demo accounts, backtest your strategies, and continuously refine your skills. With time and experience, technical analysis will become second nature.