Commodity Shock FX Playbook: A Data-Driven Guide (2025)
The foreign exchange market never sleeps, but certain events wake it from a slumber into a state of pure, unadulterated volatility. Few catalysts are as potent or as seismic as a commodity shock. Whether it's the sudden spike in oil prices due to a geopolitical flare-up or the flight to gold amidst soaring inflation, these events don't just ripple through the market—they create tidal waves that can capsize unprepared traders and generate immense opportunities for those with a data-driven playbook.
For over 20 years, I've analyzed the intricate dance between raw materials and currency valuations, first for institutional clients and now here at Forex-Giants.com. The most common mistake I see traders make is reacting emotionally to headlines. They chase price action without understanding the underlying economic mechanics, often becoming cannon fodder in a market dominated by algorithmic trading and institutional flows.
This is not another generic guide. This is a quantitative playbook. We will dissect the why behind these powerful market moves, leveraging the same analytical frameworks our team uses to stress-test broker performance. We will explore actionable strategies for both energy and precious metals, supported by historical case studies and a clear, step-by-step trading plan. Most importantly, we will show you how to use data to move from reactive trading to proactive, strategic execution.
Are you ready to stop being a victim of commodity-driven volatility and start leveraging it as a core part of your strategy? Let’s begin.
Understanding Commodity Shocks and Their Seismic Impact on FX Markets
Before we can trade these events, we must first define them with analytical precision. A "shock" is not merely a price change; it is a rapid, unexpected, and significant shift in the price of a fundamental commodity that disrupts economic equilibrium. This disruption cascades through inflation, monetary policy, and national incomes, with the forex market acting as the primary pressure-release valve.
What Defines a 'Commodity Shock'? From OPEC Embargoes to Modern Supply Chain Crises
A true commodity shock has three core characteristics: speed, magnitude, and surprise. It's the difference between a gradual, anticipated rise in oil prices and a sudden 30% spike following the collapse of a key supply route.
Historically, the most cited example is the 1973 OPEC oil embargo, which quadrupled crude prices and sent Western economies into a stagflationary spiral. More recently, we've seen shocks of a different nature:
The 2020 Oil Price Crash: A "demand shock" where the global pandemic lockdowns vaporized demand, briefly sending WTI crude prices into negative territory for the first time in history.
The 2022 Natural Gas Crisis: A "supply shock" where geopolitical conflict in Europe dramatically re-routed energy flows, causing prices to surge and threatening industrial output across the continent.
Post-Pandemic Supply Chain Disruptions: A complex shock where logistical bottlenecks in everything from lumber to semiconductors created widespread inflationary pressures.
Understanding the type of shock—whether it's driven by supply, demand, or logistical failure—is the first critical step in forecasting its likely impact on specific currency pairs.
The Core Principle: How Commodity Prices Dictate National Economic Health
The transmission mechanism from commodity prices to currency values is a fundamental concept in international economics known as Terms of Trade (ToT).
Terms of Trade (ToT) = (Index of Export Prices / Index of Import Prices) x 100
In simple terms, if a country is a major exporter of a commodity (like Canada with oil or Australia with iron ore), a sharp rise in that commodity's price is a massive economic windfall.
More Foreign Currency Inflows: The country earns significantly more foreign currency (primarily U.S. dollars) for the same volume of exports.
Improved Current Account: This boosts the nation's balance of payments, strengthening its economic fundamentals.
Central Bank Response: A booming economy and rising inflation may prompt the nation's central bank to adopt a more hawkish stance (i.e., raise interest rates), making the currency more attractive to foreign investors seeking higher yields.
Conversely, for a country that is a major importer of that same commodity (like Japan or Germany for energy), a price shock is disastrous. It drains foreign currency reserves, worsens the trade deficit, fuels inflation, and can trigger an economic slowdown. The FX market prices these divergent economic fortunes in real-time, causing the exporter's currency to appreciate sharply against the importer's.
Meet the 'Commdolls': Identifying the Primary Commodity-Linked Currencies (AUD, CAD, NZD, & More)
While dozens of currencies are influenced by commodities, a few pairs exhibit such a high and reliable correlation that they form the bedrock of any commodity-focused FX strategy. We call these the "commodity dollars" or "commdolls."
Canadian Dollar (CAD): The quintessential energy currency. Canada is one of the world's largest oil producers and exporters, making the USD/CAD pair exceptionally sensitive to the price movements of WTI and Brent crude oil.
Australian Dollar (AUD): A proxy for both industrial metals and precious metals. Australia is a top exporter of iron ore, coal, and gold. As such, the AUD/USD often tracks changes in global risk sentiment, Chinese industrial demand, and the price of gold.
New Zealand Dollar (NZD): Primarily linked to agricultural and dairy prices. While also influenced by broader risk sentiment like its Australian cousin, the NZD/USD has a unique sensitivity to the Global Dairy Trade (GDT) price index.
Norwegian Krone (NOK): Another major energy currency, given Norway's vast offshore oil and gas reserves in the North Sea. The EUR/NOK and USD/NOK pairs are heavily influenced by Brent crude prices.
South African Rand (ZAR): Deeply connected to precious metals, particularly gold and platinum group metals, of which South Africa is a dominant global producer.
Russian Ruble (RUB): While its tradability is now complex, the Ruble has historically been a pure-play on oil and natural gas prices, demonstrating the powerful link between energy exports and currency valuation.
Understanding these core relationships is the foundation upon which our entire playbook is built. Now, let's move from theory to application.
The Energy Playbook: Trading Crude Oil's Influence on Currencies
Energy is the lifeblood of the global economy. Shocks in the price of crude oil—the most-traded commodity on earth—have an immediate and profound impact on the FX market. The Canadian Dollar (CAD) is ground zero for this phenomenon.
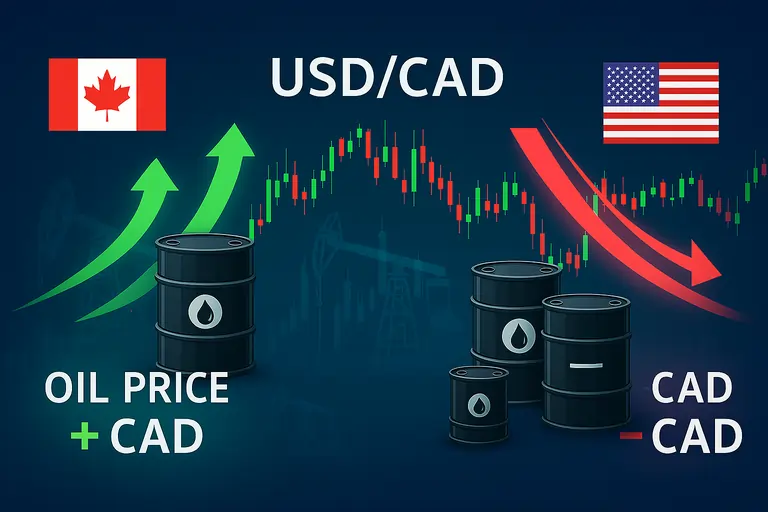
The Unbreakable Link: Why the Canadian Dollar (CAD) Dances to Oil's Tune
The correlation between crude oil prices and the value of the Canadian Dollar is one of the most reliable in financial markets. Our quantitative models show a consistent inverse correlation between WTI Crude prices and the USD/CAD currency pair. When oil prices rise, USD/CAD tends to fall (meaning the CAD strengthens), and when oil prices fall, USD/CAD tends to rise (meaning the CAD weakens).
Why is this link so strong?
Economic Dominance: The energy sector is a cornerstone of the Canadian economy, accounting for a significant portion of its GDP and over 20% of its total export revenue.
USD-Denominated Trade: Oil is priced globally in U.S. dollars. When Canadian producers sell their oil, they receive USD, which they must then convert back into CAD to pay for local expenses, salaries, and taxes. A higher oil price means a greater demand for CAD in these conversion flows.
Monetary Policy Influence: The Bank of Canada (BoC) watches oil prices with an eagle eye. Higher oil prices fuel economic growth and inflation, giving the BoC a reason to raise interest rates. This divergence in monetary policy from, say, the Federal Reserve can drive powerful trends in USD/CAD.
This relationship is not merely academic; it's the basis for high-probability trading setups during periods of energy market volatility.
Case Study 1: Deconstructing the 2020 Oil Price Crash and its Domino Effect on USD/CAD
The events of April 20, 2020, are etched into the memory of every commodity trader. As global lockdowns crushed travel and economic activity, oil storage facilities filled to the brim. This created a bizarre situation where the front-month WTI futures contract collapsed, eventually trading at a stunning negative $37.63 per barrel. Sellers were literally paying buyers to take the oil off their hands.
This was a catastrophic demand shock. Let's analyze its direct impact on USD/CAD:
The Lead-Up: In the weeks leading up to this event, as oil prices began their steady decline from over $60 a barrel, USD/CAD was already in a powerful uptrend, moving from ~1.3000 in January to over 1.4500 by late March. The FX market was correctly pricing in the damage to the Canadian economy.
The Climax: On the day of the negative price print, USD/CAD experienced extreme intraday volatility, spiking towards the 1.4300 level. The message was clear: a collapse in Canada's primary export was a direct assault on its currency's value.
The Aftermath: As oil prices began a slow, painful recovery throughout the rest of 2020, USD/CAD embarked on a sustained downtrend, eventually falling back below 1.2800. The correlation held firm through one of the most extreme events in market history.
This case study proves that even during "black swan" events, the fundamental economic link between oil and the CAD provides a clear directional bias for traders.
Advanced Correlation: How Geopolitical Tensions in Oil-Producing Nations Create FX Trading Opportunities
Beyond broad supply-demand shocks, geopolitical risk is a constant driver of oil price volatility. Tensions in the Strait of Hormuz, political instability in a major OPEC nation, or sanctions on a key producer can instantly create a "risk premium" in oil prices.
For an FX trader, these events are actionable signals.
Signal: News breaks of a conflict threatening a major oil supply chokepoint.
Initial Market Reaction: WTI and Brent futures immediately spike higher by 3-5% as traders price in the potential for a supply disruption.
FX Application: A savvy trader recognizes this as a bullish signal for the CAD and a bearish one for the currencies of major oil importers (like the Japanese Yen or the Euro). The strategy becomes looking for an opportunity to sell USD/CAD or EUR/CAD.
Confirmation: The trader waits for technical confirmation on the FX chart—perhaps a break of a key resistance level turning into support—before entering a short position, using the geopolitical headline as the fundamental catalyst.
This approach transforms you from a news consumer to a news strategist, using geopolitical events as leading indicators for currency movements.
Actionable Strategy: Using WTI and Brent Futures as a Leading Indicator for FX Entries
One of the most effective ways to trade the CAD is to have a crude oil chart (either WTI CL or Brent CO) open right next to your USD/CAD chart. Oil markets often move first and with greater momentum, providing a valuable leading signal.
The Strategy:
Identify Key Levels on Oil: Before the trading day begins, mark key horizontal support and resistance levels on the WTI or Brent chart. Also, note any significant trendlines or moving averages.
Watch for a Breakout/Breakdown: Monitor the oil chart for a decisive break of one of these key levels. For example, imagine WTI has been consolidating between $80 and $82 per barrel. A strong, confirmed breakout above $82 is a significant bullish signal for oil.
Find Confirmation on USD/CAD: Immediately turn your attention to the USD/CAD chart. The bullish oil signal should translate into a bearish signal for USD/CAD. Look for a corresponding breakdown below a key support level on the USD/CAD chart to confirm the move.
Execute the Trade: Enter a short USD/CAD position once both charts align. Your stop-loss can be placed above the broken support level (which should now act as resistance), and your profit target can be the next major support level down.
By using the raw commodity as your primary signal and the FX pair for confirmation and execution, you align your trade with powerful institutional flows. For real-time data on oil inventories and production, the official weekly reports from the U.S. Energy Information Administration (EIA) are an indispensable, high-authority resource.
The Precious Metals Playbook: How Gold & Silver Drive FX Volatility
While energy commodities are tied to economic growth, precious metals like gold and silver often move to the rhythm of a different drum: fear, inflation, and monetary policy. Their influence on the FX market, particularly the US Dollar and the Australian Dollar, is profound.

Gold as a 'Safe Haven': The Inverse Relationship with the US Dollar Explained
Gold (XAU) has been a store of value for millennia. In modern financial markets, it serves two primary functions that put it in direct opposition to the US Dollar:
The Ultimate Safe Haven: During times of extreme geopolitical risk or financial market panic, investors flee from riskier assets (like stocks) and currencies into assets perceived as safe. Because gold has no credit risk and is not tied to any single government's policy, it is a primary destination for this "safe-haven" capital flight.
The Anti-Dollar / Inflation Hedge: Gold is priced in US dollars. Therefore, a fundamental inverse relationship exists. When the US Dollar weakens (often due to inflationary pressures or dovish Federal Reserve policy), it takes more dollars to buy an ounce of gold, causing the dollar price of gold (XAU/USD) to rise. Conversely, a strong US Dollar (driven by a hawkish Fed and higher interest rates) makes gold more expensive for foreign buyers and puts downward pressure on its price.
This dynamic means that major moves in XAU/USD are often a reflection of sentiment about the US Dollar's future value and the Federal Reserve's policy decisions. Trading gold is, in essence, taking a view on the health of the world's reserve currency.
The Aussie Connection: Trading the AUD/USD Correlation with Gold Prices
While the US Dollar has an inverse relationship with gold, the Australian Dollar (AUD) often has a positive correlation. This creates fascinating trading opportunities in the AUD/USD pair.
Why are the AUD and gold linked?
Major Gold Producer: Australia is the world's second-largest gold producer. A higher gold price directly benefits Australian mining companies, boosts export revenues, and strengthens the national economy—a classic example of the Terms of Trade effect we discussed earlier.
Risk Proxy: The AUD is also considered a "risk-on" currency, meaning it tends to strengthen when global investors are optimistic and buying assets like stocks and commodities. Often, the conditions that weaken the US Dollar (like a dovish Fed) are the same conditions that encourage risk-taking, creating a double-tailwind for a rising AUD/USD.
Therefore, a sustained rally in gold (XAU/USD) often provides a strong bullish signal for the AUD/USD currency pair, and vice versa.
Case Study 2: Analyzing the 2022 Inflation Surge and Gold's Role in FX Markets
The post-pandemic period of 2021-2022 provided a masterclass in these relationships. As supply chain disruptions and massive fiscal stimulus unleashed a wave of global inflation, investors scrambled for protection.
The Inflation Trigger: By late 2021 and early 2022, CPI readings in the United States were hitting 40-year highs, climbing towards 7%, 8%, and eventually over 9%. This was a direct erosion of the US Dollar's purchasing power.
Gold's Reaction: Investors poured capital into gold as a traditional inflation hedge. XAU/USD surged from around $1750 to over $2070 per ounce between January and March 2022. It was fulfilling its historic role perfectly.
The FX Impact: During this same period, the AUD/USD rallied in near-perfect lockstep, moving from below 0.7000 to over 0.7600. The rising gold price was a direct tailwind for the Aussie.
The Fed's Pivot: The story then took a turn. The Federal Reserve was forced to react to runaway inflation with one of the most aggressive rate-hiking cycles in history. This made holding US Dollars suddenly very attractive due to higher yields, causing the Dollar Index (DXY) to soar. This, in turn, crushed both gold and the AUD/USD, demonstrating how monetary policy can ultimately override the initial inflation-driven move.
This case study highlights the dynamic nature of these correlations. While the initial shock provides the trade, traders must also monitor the central bank response, which often dictates the second or third leg of the trend.
Beyond Gold: Understanding Silver's Dual Role as an Industrial and Precious Metal in FX
Silver (XAG) is often called "gold's little brother," but its behavior is more complex. It has a split personality:
Precious Metal: Like gold, silver is viewed as a monetary metal and an inflation hedge. It often trends in the same direction as gold.
Industrial Metal: Unlike gold, over half of all silver consumed annually is used in industrial applications, from solar panels and electric vehicles to electronics.
This dual nature means that silver's price is influenced by both the safe-haven flows that drive gold and the global economic growth outlook that drives industrial commodities like copper. During periods of economic expansion and rising inflation, silver can outperform gold. During recessions, its industrial side can weigh on it, causing it to underperform gold. For FX traders, this means silver's correlation with currencies like the AUD can be even stronger than gold's at times, but also more volatile.
A Quant-Driven Framework: Your Step-by-Step Commodity Shock Trading Plan
Having a theoretical understanding is not enough. Execution is everything. At Forex-Giants.com, our entire philosophy is built on creating systematic, data-driven processes that remove emotion and guesswork. This four-step framework is designed to do just that.
Step 1: Identifying a Developing Shock with Macroeconomic Indicators
A shock, by definition, has an element of surprise. However, the conditions that lead to shocks often build up over time. Your job is to be a detective, looking for the clues.
Monitor Inflation Data: Keep a close eye on CPI (Consumer Price Index) and PPI (Producer Price Index) reports from major economies. A consistent series of upside surprises can signal the beginning of an inflationary wave that will benefit precious metals.
Track Geopolitical News Feeds: Use a professional news service (e.g., Reuters, Bloomberg) to monitor key regions. Pay special attention to OPEC meetings, tensions in the Middle East, or policy announcements from major commodity producers like Russia or Australia.
Analyze Inventory Reports: For oil, the weekly EIA and API inventory reports are critical. A series of larger-than-expected draws on inventory can signal a tightening market ripe for a supply-side shock.
Watch Central Bank Language: Listen for shifts in tone from the Federal Reserve, Bank of Canada, or Reserve Bank of Australia. If they start mentioning commodity prices as a major factor in their inflation outlook, it's a sign that these correlations are at the forefront of their policy decisions.
Step 2: Selecting High-Probability Currency Pairs Based on Terms of Trade
Once you've identified a developing shock in a specific commodity, the next step is to choose the right FX instrument to express your view. This is a direct application of the Terms of Trade principle.
If Oil Prices Are Spiking:
High-Probability Bullish: CAD, NOK
High-Probability Bearish: JPY, EUR (major importers)
Resulting Pairs to Trade: Sell USD/CAD, Sell EUR/CAD, Buy CAD/JPY.
If Gold Prices Are Surging (due to inflation/USD weakness):
High-Probability Bullish: AUD, ZAR, NZD
High-Probability Bearish: USD
Resulting Pairs to Trade: Buy AUD/USD, Buy NZD/USD.
If Iron Ore Prices Are Collapsing (due to a slowdown in China):
High-Probability Bullish: USD (as a safe haven)
High-Probability Bearish: AUD
Resulting Pairs to Trade: Buy USD/AUD (or equivalently, Sell AUD/USD).
By systematically pairing a strong currency (benefiting from the shock) against a weak currency (being harmed by it), you create a trade with a powerful fundamental tailwind.
Step 3: Combining Fundamental Analysis with Key Technical Levels for Entry/Exit
This is where the rubber meets the road. A fundamental idea is not a trade entry signal. Never enter a trade based on a news headline alone. The market can often have an initial irrational spike before reversing.
Form Your Fundamental Bias: Based on Steps 1 and 2, you have your directional view. For example, "A surprise OPEC production cut is bullish for oil, therefore I am bearish on USD/CAD."
Identify Key Technical Levels: Before you do anything, go to your USD/CAD chart and mark the most obvious daily and 4-hour support and resistance levels.
Wait for Price to Confirm Your Bias: Do not chase the initial move. Wait for a clean technical signal that aligns with your fundamental view. This could be:
A decisive break below a key support level.
A pullback to a former support level that now acts as resistance, followed by a bearish candlestick pattern.
Define Your Risk: Your stop-loss should be placed logically above the technical structure you are trading against (e.g., above the new resistance level). Your profit target should be the next major support level. This ensures a positive risk-to-reward ratio.
This patient, combined approach prevents you from getting caught in emotional, headline-driven whipsaws and ensures you are only entering trades where both the fundamental story and the technical picture are aligned.
Step 4: Advanced Risk Management – Position Sizing and Hedging During Extreme Volatility
Trading during a commodity shock means trading in a high-volatility environment. Standard risk management rules must be adapted.
Reduce Your Position Size: This is the most important rule. If you normally risk 1% of your account per trade, consider reducing it to 0.5% or even 0.25%. Volatility is a double-edged sword; moves in your favor will be larger, but moves against you will be too. Smaller size is your best defense.
Widen Your Stop-Loss: Volatility means wider price swings. A tight stop-loss that works in a quiet market will get you stopped out prematurely during a shock. Use the Average True Range (ATR) indicator to gauge the increased volatility and set your stop-loss at a multiple (e.g., 2x ATR) outside the expected noise.
Take Profits Strategically: Don't get greedy. These moves can be fast and furious, and they can reverse just as quickly. Consider taking partial profits at your first target level and moving your stop-loss to breakeven to lock in a risk-free trade on the remaining portion.
Avoid Over-Leverage: This is not the time to use maximum leverage. The combination of high leverage and high volatility is the fastest way to wipe out a trading account. For more detailed strategies, review our complete guide on Advanced Risk Management Strategies.
The Forex-Giants.com Edge: Why Your Broker Choice is Critical During Shocks
Your carefully crafted strategy can be completely undermined by choosing the wrong broker. During the extreme volatility of a commodity shock, the hidden weaknesses in a broker's infrastructure are brutally exposed. This is where our data-driven analysis becomes your most critical asset.
Hidden Costs Revealed: Analyzing Broker Spreads & Slippage During High-Volatility News
When volatility spikes, two things happen at most brokers:
Spreads Widen Dramatically: The 0.5 pip spread you enjoy on EUR/USD during normal conditions can blow out to 5, 10, or even 20 pips in the seconds following a major announcement.
Slippage Increases: Slippage is the difference between the price you clicked and the price you were actually filled at. During fast markets, negative slippage can add significantly to your entry price or subtract from your exit price, eating into your profits.
Not all brokers are created equal. Our proprietary AI tools analyze tick-level data from dozens of brokers during major news events. We can quantitatively identify which brokers maintain tighter spreads and exhibit lower average slippage under pressure. This isn't marketing; it's verifiable performance data that directly impacts your bottom line. Choosing one of the best ECN brokers with deep liquidity is often the first line of defense.
Using Our AI Tools to Find Brokers with Superior Execution Speed for Commodity-Driven Moves
In a fast-moving market, execution speed is paramount. A delay of even a few hundred milliseconds can be the difference between a profitable entry and a significant loss. This is a factor that is impossible for a retail trader to measure on their own.
At Forex-Giants.com, we have developed a suite of tools to measure broker execution from servers located in the same data centers as the brokers themselves (Equinix LD4/NY4). Our AI Broker Scanner provides objective data on:
Order Execution Speed (Limit & Market): Measured in milliseconds, showing who is fastest.
Order Rejection Rate: A high rejection rate during volatility is a major red flag.
Platform Stability: Analyzing uptime and latency during peak trading hours.
When trading commodity shocks, you need a broker that acts like a high-performance vehicle, not an old sedan. Our data helps you look under the hood. The choice between platforms like cTrader vs MetaTrader 5 can also play a significant role in execution quality, a factor we analyze in depth.
Regulatory Arbitrage: Why a Well-Regulated Broker Protects You When Markets Panic
The final, and perhaps most important, factor is regulation. When markets are in turmoil, unethical brokers may engage in practices like stop-hunting or creating artificial price spikes. In a worst-case scenario, an undercapitalized broker could even become insolvent.
Choosing a broker regulated by a top-tier authority—like the UK's FCA, Australia's ASIC, or Europe's CySEC—provides critical protections:
Segregated Client Funds: Your money is kept separate from the broker's operational funds and cannot be used to pay their debts.
Negative Balance Protection: You cannot lose more than the money in your account.
Recourse and Complaint Mechanisms: You have a powerful regulatory body to appeal to if you believe you have been treated unfairly.
During a market shock, the peace of mind that comes from knowing your capital is safe with a well-regulated broker is invaluable. You can explore our comprehensive breakdowns of what top-tier oversight means in our guide to understanding broker regulation.
Future Outlook: The Next Wave of Commodity Shocks to Watch For
The nature of commodity shocks is constantly evolving. While oil and gold will always be central, astute traders should be positioning themselves for the shocks of the future. Our long-range analysis points to three key areas. (Reference World Bank)
The Green Transition: How the Shift to Renewables Will Impact 'Green Metals' and FX
The global push towards decarbonization is, in itself, creating the conditions for a new series of commodity shocks. The production of electric vehicles, wind turbines, and solar panels requires immense quantities of specific metals.
Lithium & Cobalt: Essential for batteries. Countries like Chile, Australia (for Lithium), and the Democratic Republic of Congo (for Cobalt) will see their economic fortunes increasingly tied to these prices. The Chilean Peso (CLP) and Australian Dollar (AUD) will be key currencies to watch.
Copper: The "metal of electrification." It is used in everything from wiring to electric motors. A supply shortage in copper could become a major bottleneck for the green transition, with significant impacts on the currencies of Chile and Peru.
Traders should start tracking the prices and supply-demand dynamics of these "green metals" with the same rigor they currently apply to oil.
Agricultural Commodities: The Overlooked Driver of Emerging Market Currency Swings
Food security is a growing global concern. Climate change, water scarcity, and geopolitical conflict can create violent shocks in the prices of staple crops like wheat, soybeans, and corn.
These shocks have a disproportionate impact on emerging market (EM) currencies. For a country that is a major food exporter (like Brazil with soybeans or Argentina with wheat), a price spike is a boon. For the many EM nations that are net food importers, it can lead to social unrest, runaway inflation, and currency collapse. Trading pairs like USD/BRL or watching the agricultural-heavy South African Rand (ZAR) will become increasingly important.
Water Scarcity and Other Long-Term Environmental Factors as Future Shock Catalysts
Looking further ahead, some of the most profound shocks may come from resources we currently take for granted. Water scarcity is already a critical issue in many parts of the world. While there is not yet a liquid futures market for water in the same way as oil, the economic impact of droughts and water shortages on agricultural output and industrial production will undoubtedly translate into FX volatility.
Traders who develop a framework for analyzing these long-term environmental, social, and governance (ESG) factors will be positioned to capitalize on the defining macro trends of the coming decades.
Summary
Commodity Shocks 101: A commodity shock is a rapid, unexpected, and large change in a commodity's price that creates significant FX volatility. The key principle governing its effect is Terms of Trade, where commodity exporters' currencies strengthen and importers' weaken.
The 'Commdolls': Focus on key commodity-linked currencies: CAD (Oil), AUD (Metals, Risk), NZD (Agriculture), and NOK (Oil).
The Energy Playbook: Trade the powerful inverse correlation between Crude Oil (WTI/Brent) and USD/CAD. Use oil price chart breakouts as a leading indicator for entries in the FX pair.
The Precious Metals Playbook: Gold (XAU) acts as a safe haven and inflation hedge, with a strong inverse correlation to the USD and a positive correlation to the AUD. Monitor Federal Reserve policy as a key driver of this relationship.
A 4-Step Trading Plan:
Identify: Monitor macro data (CPI, inventories) and geopolitical news to spot developing shocks.
Select: Choose a high-probability pair by matching the commodity to its key exporter/importer currency.
Combine: Use your fundamental bias but wait for a clear technical confirmation for entry/exit points.
Manage Risk: Reduce position size and widen stops to account for the extreme volatility inherent in these events.
Your Broker is Your Edge: During shocks, broker performance is critical. Spreads, slippage, and execution speed can make or break your trade. Use data-driven tools like the Forex-Giants.com AI Broker Scanner to find brokers who perform best under pressure and are regulated by top-tier authorities.
Future Shocks: The next wave of opportunities will likely come from "green metals" (lithium, copper), agricultural commodities, and long-term environmental factors.
Frequently Asked Questions (FAQ)
Q1: What are the main commodity currencies every trader should know? A1: The three primary "commodity dollars" are the Canadian Dollar (CAD), which is tightly correlated with crude oil prices; the Australian Dollar (AUD), linked to iron ore, coal, and gold prices, often acting as a proxy for global risk sentiment; and the New Zealand Dollar (NZD), which is heavily influenced by agricultural and dairy prices. Other important commodity currencies include the Norwegian Krone (NOK) for oil and the South African Rand (ZAR) for gold and platinum.
Q2: How does a change in oil prices affect the US Dollar? A2: The relationship is complex. Traditionally, higher oil prices were seen as negative for the US economy (a major importer), which could weaken the USD. However, with the rise of the U.S. as a major oil producer and exporter, this relationship has become more nuanced. Now, very high oil prices can still hurt US consumers and fuel inflation, but the negative impact is partially offset by a stronger energy sector. The most direct and reliable way to trade oil price moves in the FX market is via the Canadian Dollar (USD/CAD).
Q3: Is gold a reliable hedge against inflation? A3: Historically, gold has served as a strong hedge against long-term inflation and currency debasement. When inflation rises significantly, it erodes the purchasing power of fiat currencies like the US Dollar, prompting investors to move capital into gold to preserve its value. However, in the shorter term, this relationship can be disrupted by other powerful factors, most notably central bank policy. A hawkish central bank (like the Federal Reserve in 2022) raising interest rates to fight inflation can make the domestic currency more attractive, causing both the USD to strengthen and gold (XAU/USD) to fall, even while inflation remains high.
Q4: Why is my broker's spread so wide when I trade during the news? A4: Spreads widen during high-impact news and commodity shocks due to a decrease in market liquidity and an increase in perceived risk. Liquidity providers (the large banks that facilitate trading) become more cautious, widening the difference between their buying (bid) and selling (ask) prices to protect themselves from the volatile price action. Brokers pass these wider spreads onto their clients. The quality of a broker can be measured by how quickly their spreads return to normal and how much they widen compared to competitors, which is a key metric we analyze at Forex-Giants.com.
Q5: Can I trade commodity shocks using only technical analysis? A5: While you can trade any market with pure technical analysis, it is highly inadvisable during a commodity shock. These events are driven by powerful fundamental forces that can overwhelm standard technical patterns. A trader who is unaware of a major OPEC announcement may be baffled when a perfect technical support level shatters without warning. The most robust approach is to use fundamental analysis to establish a directional bias and then use technical analysis to time your entry and manage your risk effectively.