Decoding Market Geometry: The Ultimate Guide to Trading Harmonic Patterns in Forex
Forex markets move in cycles. These cycles often repeat. Traders observing price action over decades have identified specific geometric structures occurring before significant reversals. These structures are Harmonic Patterns. Harmonic trading utilizes specific Fibonacci ratios to define precise turning points. Unlike general chart patterns like triangles or wedges, harmonic patterns demand mathematical precision. A pattern is either valid based on the numbers, or it is invalid. There is no middle ground.
This guide defines the mechanics of market geometry. It explains how to identify, measure, and trade the most reliable harmonic setups in the current 2025 financial climate. Understanding these concepts allows you to predict potential price movements with a higher degree of accuracy.
The Mathematical Foundation: Fibonacci Ratios
Harmonic trading relies entirely on Fibonacci numbers. The sequence (0, 1, 1, 2, 3, 5, 8, 13, 21, 34, 55, 89...) provides the ratios used to measure price waves. Price action tends to respect these mathematical proportions. The most critical ratio is 0.618. Traders call this the Golden Ratio. It appears frequently in nature and financial markets.
Other primary ratios derived from this sequence include:
0.382: Derived by dividing a number in the sequence by the number two places to the right.
0.786: The square root of 0.618.
0.886: The fourth root of 0.618 or the square root of 0.786.
1.272: The square root of 1.618.
1.618: The inverse of 0.618.
You must memorize these numbers. They form the skeleton of every harmonic pattern. Without the correct ratio alignment, a visual shape on the chart means nothing.
The ABCD Pattern: The Building Block
Most harmonic patterns contain a core structure known as the ABCD pattern. This simple formations consists of three legs:
AB Leg: The initial price impulse.
BC Leg: A retracement of the AB leg.
CD Leg: An extension moving in the same direction as the AB leg.
In a perfect ABCD pattern, the AB leg equals the CD leg in length. Time symmetry also plays a role. The time taken to form the AB leg should roughly equal the time for the CD leg. The BC retracement usually terminates at the 0.618 or 0.786 level of the AB leg. If BC retraces to 0.618, the CD extension should target the 1.618 extension of BC. If BC retraces to 0.786, the CD extension typically targets 1.272.
Recognizing this structure aids in identifying complex patterns. The ABCD formation often represents the final two legs of 5-point patterns like the Gartley or Bat.
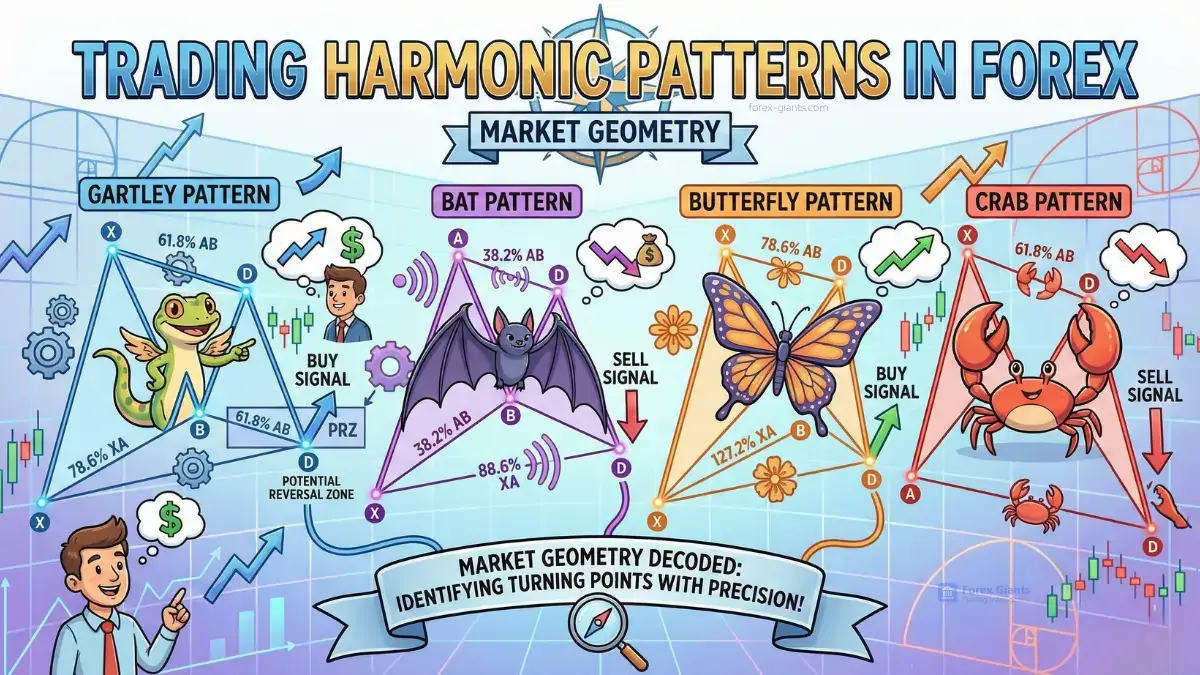
The Gartley Pattern: The Classic Retracement
H.M. Gartley introduced this pattern in 1935. It remains one of the most reliable trade setups. The Gartley resembles an 'M' or 'W' on the chart. It contains five points: X, A, B, C, and D.
Rules for Identification
XA Leg: A strong impulse move.
AB Leg: Price retraces to the 0.618 level of XA. This rule is strict. A retracement measuring 0.50 or 0.70 invalidates the structure.
BC Leg: Price retraces 0.382 to 0.886 of the AB leg.
CD Leg: Price extends to complete the pattern. The D point must terminate at the 0.786 retracement of the XA leg.
Completion: The AB=CD pattern completes at the same point as the 0.786 XA retracement.
Trading the Gartley
You enter the market at point D. This is the Potential Reversal Zone (PRZ). Place your stop loss slightly beyond point X. If price breaks point X, the pattern has failed. Target the 0.382 and 0.618 retracement levels of the AD leg for profit taking. The Gartley offers an excellent risk-to-reward ratio because the stop loss is tight relative to the potential target.
The Bat Pattern: Precision Trading
Scott Carney discovered the Bat pattern in 2001. It looks similar to the Gartley but involves different ratios. The Bat pattern is distinct because of its deep retracement at point D.
Rules for Identification
XA Leg: An impulse move.
AB Leg: Price retraces less than the Gartley. It typically hits the 0.382 or 0.50 level of XA. It must not touch the 0.618 level.
BC Leg: A retracement of 0.382 to 0.886 of the AB leg.
CD Leg: The final leg extends to the 0.886 retracement of the XA leg.
Trading the Bat
The D point at the 0.886 retracement defines the entry. This deep retest of the X point often results in a sharp reversal. The Bat pattern frequently offers a better risk-reward profile than the Gartley because the entry is closer to the invalidation point (X). Place stops immediately below or above X. The initial target is the 0.382 retracement of AD. The second target is the 0.618 level.
The Butterfly Pattern: Catching Extremes
The Butterfly pattern differs significantly from the Gartley and Bat. It is an extension pattern. Point D forms beyond point X. This structure helps traders identify the end of a trend move to catch a new reversal.
Rules for Identification
XA Leg: Impulse move.
AB Leg: Deep retracement to the 0.786 level of XA.
BC Leg: Retracement of 0.382 to 0.886 of AB.
CD Leg: Extension beyond X. Point D completes at the 1.27 or 1.618 extension of the XA leg.
Trading the Butterfly
Traders often fear buying or selling at new highs or lows. The Butterfly requires exactly this action. You enter at point D, which represents a new price extreme. A valid Butterfly signals exhaustion. The reversal from point D is often powerful. Place stops beyond the 1.618 extension level. Targets remain the standard Fibonacci retracements of the AD leg.
The Crab Pattern: Volatility Hunter
The Crab pattern allows for extreme price action. It possesses the longest extension of all harmonic patterns. It signifies a volatile market environment where price overshoots significantly before reversing.
Rules for Identification
XA Leg: Impulse move.
AB Leg: Retracement between 0.382 and 0.618 of XA.
BC Leg: Retracement of 0.382 to 0.886 of AB.
CD Leg: A massive extension. Point D terminates at the 1.618 extension of XA. The BC projection often extends as far as 2.24 or 3.618.
Trading the Crab
The Crab requires patience. Price moves swiftly during the CD leg. Entering too early results in losses. Wait for price to touch the 1.618 XA extension. Confirm the reversal with candlestick patterns like pin bars or engulfing candles at the PRZ. The stop loss goes slightly beyond the 1.618 level. Due to the extreme nature of the reversal, profit targets are often large.
The Shark Pattern: The Modern Structure
The Shark pattern is a newer discovery. It relies on 88.6% retracements and 113% extensions. It works well in choppy markets.
Rules for Identification
OX Leg: Initial impulse.
XA Leg: Retracement consisting of an impulsive wave.
AB Leg: Retracement between 1.13 and 1.618 of the XA leg.
BC Leg: Extension to 0.886 or 1.13 of the OX leg.
Trading the Shark
Trade the C point. The entry occurs at the 0.886 retracement of the OX leg or the 1.13 extension. This pattern targets the 50% retracement of the BC leg. It serves as a counter-trend setup in many cases.
The Cypher Pattern: Strict Ratios
The Cypher pattern appears less frequently but offers high reliability. It has very specific rules preventing subjective interpretation.
Rules for Identification
XA Leg: Impulse.
AB Leg: Retraces 0.382 to 0.618 of XA.
BC Leg: Extends beyond A. It must hit the 1.272 extension of XA but not close beyond the 1.414 level.
CD Leg: Retraces to 0.786 of XC.
Trading the Cypher
The entry is at point D (0.786 of XC). Stops go beyond point X. Targets are the 0.382 and 0.618 retracements of CD. The Cypher excels in trending markets during a deep correction phase.
Constructing the Potential Reversal Zone (PRZ)
Locating the pattern is step one. Identifying the Potential Reversal Zone (PRZ) is step two. The PRZ is rarely a single price point. It is a tight area where multiple Fibonacci levels converge.
Example of PRZ Convergence:
The 0.786 retracement of XA (Gartley rule).
The AB=CD completion point.
The 1.27 or 1.618 extension of the BC leg.
When these three numbers cluster within a few pips of each other, the probability of a reversal increases. A tight PRZ indicates strong harmonic confluence. A wide PRZ suggests a weak pattern. Avoid trading patterns with scattered convergence levels.
Execution Strategies in 2025
Modern markets move fast. Algorithms dominate price action. Manual execution requires discipline. Use these strategies to enter harmonic trades:
Limit Orders
Place a limit order at the specific D point ratio. This guarantees entry at the best price. Use this method for Bat and Gartley patterns where the invalidation point is close. The risk is price missing your order by a pip before reversing.
Market Execution with Confirmation
Wait for price to hit the PRZ. Watch for a reaction. A rejection wick, a Doji, or a shift in lower timeframe structure confirms the level holds. Enter at market price once confirmation appears. This method sacrifices entry precision for higher win rates. It prevents entering a trade where price slices through the PRZ without pausing.
Risk Management Protocols
Harmonic trading is not magic. Patterns fail. A strong trend often blows through a counter-trend harmonic setup. Risk management preserves your capital.
Stop Loss Placement: Always define the invalidation point. For a Gartley, it is below X. For a Bat, it is below X. For a Butterfly, it is below the 1.414 or 1.618 level depending on your risk tolerance. Never move a stop loss to accommodate a losing trade. If the pattern breaks, the trade is void.
Position Sizing: Calculate risk based on the distance to the stop loss. If the stop is 50 pips away, adjust lot size to risk only 1% or 2% of account equity. Do not use a fixed lot size for every trade. The distance from entry to stop loss varies with volatility and timeframe.
Profit Taking: Split your position. Close half at the first target (0.382 of AD). Move the stop loss to breakeven. Close the remaining portion at the second target (0.618 of AD) or trail the stop to catch a larger trend extension. This strategy secures profit early while leaving room for runners.
The Psychology of Harmonic Trading
Patience defines the successful harmonic trader. You will see incomplete patterns constantly. A structure might look like a Gartley but miss the 0.618 ratio by ten pips. You must ignore it. Trading imperfect patterns leads to losses. Waiting for the specific ratio test requires mental discipline.
Trust the math. When the pattern completes at the PRZ and you have set your risk, take the trade. Hesitation causes missed opportunities. Fear of loss often prevents traders from executing valid setups. Remember, a series of trades determines success, not a single outcome.
Tools for the Modern Trader
Manual calculation takes time. In 2025, advanced charting platforms offer automated harmonic recognition tools. These indicators scan multiple timeframes and currency pairs simultaneously. They highlight potential XABCD structures and project the PRZ automatically.
Use these tools to filter the market. Verify the ratios manually. Algorithms occasionally misidentify pivot points in high-volatility environments. The human eye remains superior for context. Check the higher timeframe trend. A bearish Gartley forming against a massive bullish weekly trend has a lower probability of success. Align the pattern with the dominant market flow.
Failure Patterns: The Hidden Opportunity
A failed pattern offers valuable information. When price blasts through a PRZ without pausing, it signals immense momentum. This is a "Bust" pattern. Stop looking for a reversal. Switch to a breakout strategy. If price breaks the X point of a bullish Gartley, the market is signaling strong bearish intent. Trade with the momentum. The failure of one setup is the confirmation of a trend continuation.
Summary of Key Ratios
Keep this reference list accessible:
Gartley: B=0.618, D=0.786
Bat: B<0.618, D=0.886
Butterfly: D=1.27
Crab: D=1.618
Final Strategic Considerations
Market geometry provides a structured way to interpret chaos. It removes subjectivity from support and resistance analysis. By focusing on the XABCD structure and strict Fibonacci ratios, you filter out market noise. Success comes from rigorous adherence to the rules. Do not bend the numbers to fit your bias. If the ratios do not align, no trade exists. Focus on the highest quality setups. Master the Gartley and Bat first. These two patterns appear most frequently and offer stable results. As your expertise grows, incorporate the Butterfly and Crab to capture market extremes. Trading is a business of probabilities. Harmonic patterns tilt those probabilities in your favor.


