Category
technical-analysis
Showing all articles in the "technical-analysis" category.

Why Trading Divergences (RSI, MACD) Matters Now The Bank for International Settlements reports daily global foreign exchange market turnover exceeding $...
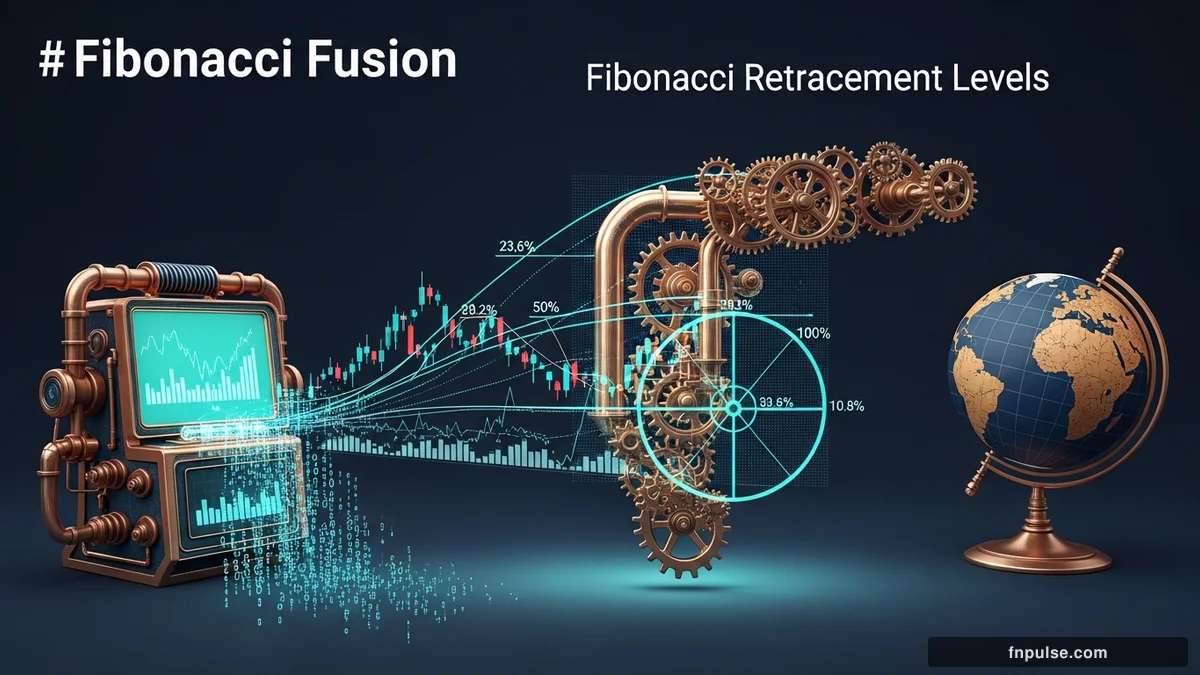
Understanding Fibonacci Retracement Levels Mathematical sequences dictate financial market movements. Traders apply Fibonacci retracement levels to ide...

Understanding a Bollinger Bands Strategy John Bollinger introduced this indicator in the 1980s to measure market volatility. A Bollinger Bands strategy...

Understanding the MACD Indicator Guide The Moving Average Convergence Divergence tool measures trend momentum. Traders rely on a comprehensive macd ind...

Understanding Chart Patterns (Head & Shoulders, Triangles, Flags) The foreign exchange market processes $7. 5 trillion in daily trading volume according...

Your Complete Candlestick Patterns Guide Japanese rice traders developed candlestick charts in the 18th century. Today, forex traders worldwide use thi...

Understanding the RSI Indicator Explained The Relative Strength Index (RSI) is a momentum oscillator developed by J. Welles Wilder Jr.

Understanding Moving Averages (SMA, EMA, WMA) Moving averages smooth out price data to create a single flowing line, making it easier to identify the di...

Understanding Support & Resistance Levels Support and resistance levels represent key price points on a chart where the forces of supply and demand meet...